Google Analytics data is an absolute feast of unlocked potential.
Most people only use Google Analytics for reporting purposes, missing out on some of the most effective and actionable insights available to site owners.
Did you know that you can use your Google Analytics data to improve your site SEO, user journeys and conversation rate optimisation?
In fact, if you’re not yet utilising the vast array of data available in Google Analytics for SEO, then you might be missing out on some very good opportunities.
In this article we look at ways in which you find unique insights from Google Analytics that will allow you to climb up the search rankings, generate more traffic and, ultimately, increase your conversion rates.
These tips can be applied to all websites, from ecommerce stores to local businesses, as long as you have sufficient data you can put it to good use for optimising your site.
Since many of these tips involve using data, you could also find my article on Excel formulas for SEO quite helpful.
Here are my top 8 tips for optimising your site based on Google Analytics data..
1. Find Time-on-Page Anomalies

Time-on-page (and dwell time) are ranking factors that tell search engines whether or not your content was particularly relevant or interesting to the user.
Of course, if you find a webpage interesting or it matches what you were looking for then you will likely stay on that page longer even if you do leave after getting your answer.
Search engines will interpret a long time on page as a positive signal and reward you with improved rankings. (Source).
Sometimes you have middle-man pages that are purely intended to encourage people to take an action or click on the next page and those are fine and not what we’re looking for.
Instead, we want to find pages that we wanted users to spend time on but that currently they are not.
We’re thinking here about resource pages, articles and cornerstone content that are the backbone of any well-optimised website. These pages are what draws readers in for long reads and gives you the opportunity to earn their trust in your brand.
How to find pages with low time-on-page
In order to locate pages with a poor time-on-page metric, follow these steps:
- In Google Analytics set your date range. The bigger the better but 3 months is a good benchmark.
- Go to Behaviour > Site Content > All Pages and open up the report.
- Add a segment at the top of “Organic Traffic”.
- Now click on the metric of “Avg. Time On Page” to order the results by lowest time on page.
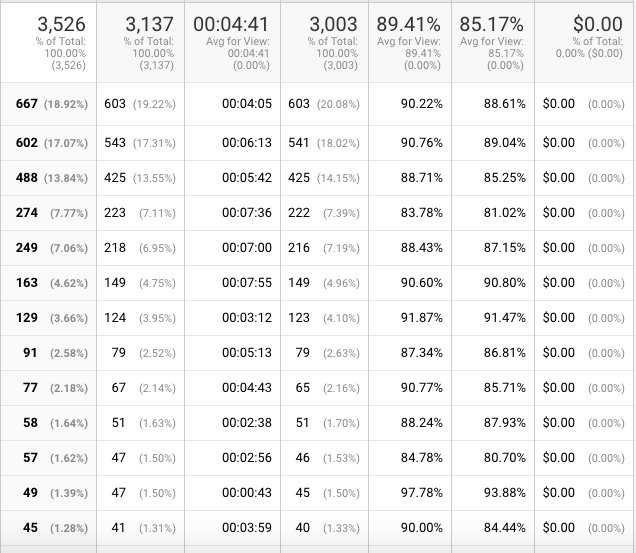
You can manually look through the results and scroll past any pages that don’t need a long time on page.
Pick out any with a low time on page and put them in a separate spreadsheet to begin working through.
Unfortunately it’s not possible to find out time on page for sessions where only one page is visited or the user left on this page.
This is because your analytics account gets this data from the time between clicks on site, which would be lacking if the user left. You should therefore take all time on page data with a pinch of salt and carefully assess the data before acting.
How to Optimise Pages With a Low Time on Page
To optimise these pages you might want to take a visual look and see what specifically is preventing people from staying on the page for very long.
The main elements you should look out for are:
- Poor structure of page (dominated by images or text blocks out of place)
- Pop ups or ads interfering with user experience
- Poorly written content
- Slow loading time of page
- Content doesn’t entice further reading in the first paragraphs
- The content isn’t relevant to the search queries
- The content is too short
- The article offers nothing interesting or noteworthy about the topic
- The article is out of date
You should make a note of all issues that you spot and then make an action plan to vastly improve the content.
You might find for example that when you visit the page it is difficult to read because of the styling. Or the opening to paragraphs are incredibly boring. The article could have been originally published a few years ago and is now out of date.
These types of small issues can be very easily solved with minor tweaks and updates.
Other issues might take more time however.
You might notice that your content is only 500 words whereas competitors have content that is well over 1,500 words. Or that the content just isn’t very well tailored to searcher intent. Content length often correlates with good organic performance rather than causes it, so it’s important to understand how better value and content quality is the solution, not mindless content length.
One interesting technique you can use is called Bucket Brigade which is the process of writing your copy using phrases that entice readers to keep reading.
Examples bucket brigade phrases include:
“Here’s the deal…”
or
“And it doesn’t stop there…”.
Simply making minor tweaks and amends across poor performing pages can actually have quite a significant effect on SEO. I’ve optimised pages that shot up from page 5 to page 1 in the SERPS just by utilising these techniques, so it can be very effective.
2. Find Topics Your Readers Have Searched For On Your Site

There is an official way to set up Google Analytics reports to be able to find data about internal search terms, as well as an unofficial way…
If you have already set up Site Search in your analytics then this is easy to do. Simply navigate to Behaviour > Site Search > Search Terms and your data will be laid out there clearly.
However, the majority of site owners aren’t aware of this feature and the fact that in needs to be set up beforehand to begin generating meaningful data.
But all is not lost!
Most websites use query string parameters in their URLs for internal searches, and so you can actually find data for internal searches from within your Behaviour > Site Content > All Pages report.
In layman’s terms this means that whenever somebody searches on your site for something, the URL automatically adds a parameter of “?s=” followed by the search term.
These then get reported in Google Analytics and you can find them in the All Pages report just by searching for “?s=” and seeing what comes up.
If you set your date range large enough you should find an absolute wealth of insights here.
What To Do With Internal Search Information
There are lots of great things you can do with internal search information that are invaluable for SEO.
The first thing to do is to ensure that information is somewhat statistically significant. If you’re doing anything drastic then this is important but otherwise it doesn’t have to be too scientific.
The logic here is to not too anything rash just because there were 2 searches for the same topic. Unless you only had 3 visitors on the site then 2 searches is usually not a high enough number to warrant any changes.
Optimise Existing Pages
Internal queries for topics that you already have pages on can be really useful for optimising your page based on the language and terminology that people use.
For example – say you have a page titled “Best rucksacks for travel”. You might notice that internal searches on your site actually use the phrase “Travel backpacks” instead. This is a great indicator about the type of terminology people use and so you can start tweaking your copy to match this.
If “rucksack” has a higher search volume than “backpack” then there is no need to change the title, instead what you can do is go through your page copy and see where it might be possible to include the term “travel backpack” either in addition to or in place of “travel backpacks”.
The effect of this is two-fold…
Firstly your internal search function will then show the relevant page when users search this term, and secondly it enriches your semantic language which we know that Google likes, thereby improving the SEO of the page.
Minor tweaks like this can help boost your traffic both from search engines and from users already on your site.
Create New Pages
The second option is incredibly straight-forward.
If people are searching your site for a topic that you don’t already have a resource on, then build one!
Internal search results are a fantastic vault of information to give you topic ideas.
It is essentially market research without having to do market research. Rather than try to figure out what content people would enjoy or like to see on your site, you already have this information!
Again, be selective here. If your website is about “eco friendly travel” for example, then you won’t want to build pages about topics that are completely out of line with your brand such as “round the world flights”.
Adding value to the overall niche of your site is more important than creating a page for every imaginable topic.
Once you notice a trend in internal searches, build up a list of the terms that people are using to find the topic, complement them with some keyword research and build a page that perfectly meets this need.
3. Nail Your Demographic Targeting

It’s fair to say that the vast majority of websites have a very specific demographic that their content is aimed at. Those who are most likely to convert.
One of the most obvious examples are local businesses.
If you are a local electrician, hair salon or a restaurant for example, then it’s fairly useless to have all of your traffic coming from a country you’re not located in.
In a similar vein, if you run a business entirely targeted at a specific gender or age and your site traffic does not match this demographic, then this is a good indication that something is wrong.
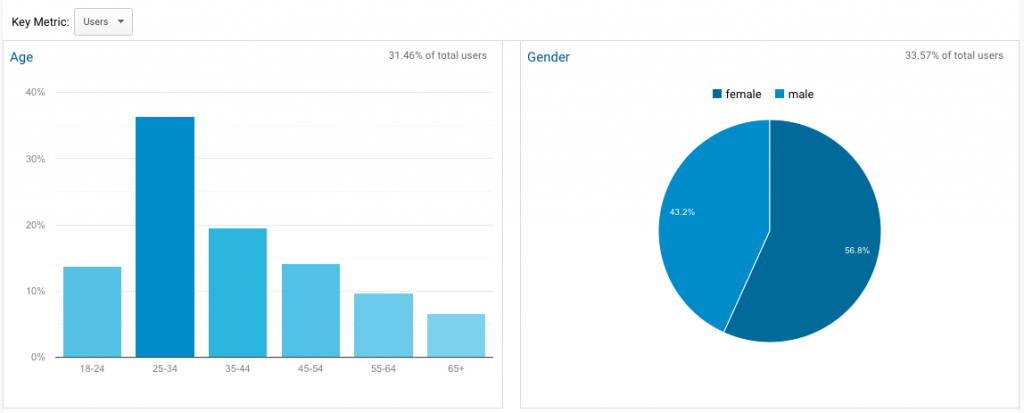
You can find a whole wealth of demographic data by delving into the Audience section of Google Analytics and focusing on Demographics and Geo.
Here you can find out the typical profile of your users, whether they are male, female, their age and their location.
If your website is not converting as well as it should then your demographic data might hold some clues as to why.
How To Use Demographic Data To Optimise Your Site
The demographic data might help you identify issues with your targeting and lack of conversions, but what can you do to help tackle this?
Geo Targeting
If you have a local business and you want to attract users primarily from one location, you should implement the following:
- Set up Google My Business using a local address and specify your service area
- Optimise your Google My Business page
- Add your site to local online directories
- Add your location to your homepage meta title
- Mention the location throughout your content i.e. “We are a restaurant based in Leeds”.
- Add your address to your footer (ensure it is written exactly the same as on your Google My Business page)
User Profile Targeting
User profile targeting is slightly more tricky.
It might be difficult to identify why you’re not attracting the demographic that your content is aimed at. Follow these steps to help you find a clearer understanding:
- Conduct a content audit of your web pages. This will help you identify and assess whether individual pages are relevant to your target audience.
- Language style – The words and tone you use can be important at attracting the right demographic.
- Assess your marketing channels. (If you’re using Instagram to advertise an over 60s cruise then you might be barking up the wrong tree.)
4. Site Speed Insights

Site speed and pagespeed are becoming increasingly more important ranking factors.
Search engines are now placing more emphasis on pages that load quickly and satisfy a great user experience, and so site speed should be taken seriously.
Sometimes you can pick up tips about slow loading pages from looking at high bounce rates. But Google Analytics already has a very nifty tool for helping you diagnose where pagespeed issues lie.
Under the Behaviour section and then Site Speed, there are a wealth of different options for you to find useful data.
The greatest insight can come from Speed Suggestions section which shows your slowest loading pages along with useful links to Google Pagespeed Insights for each individual page that lets you know where the issues lie.
What To Do With Information From Page Speed Insights
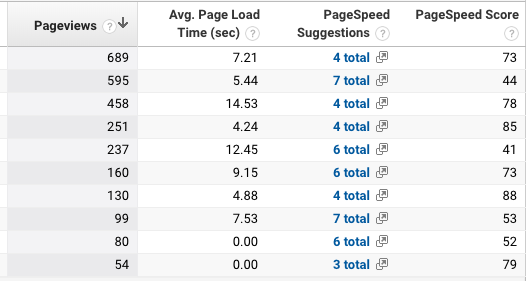
One of the most common issue for a slow loading page is very large images.
When I recently audited 11 nonprofit websites I found that there just isn’t enough knowledge about the importance of consistent, well-optimised image sizes.
Set a consistent file size target for your images and stick to it, as long as it does not affect the image quality.
A recommended size is anything up to a maximum of 100kb.
However, many other page speed fixes will be universal to the whole site rather than individual pages, and sometimes quite technical.
These include things like minifying CSS and javascript, installing a CDN, leveraging browser caching or enabling lazy loading.
Not all of these issues are easy to fix on your own but the Google reports can help you identify what issues you have and then you can pay a developer a small fee to fix them.
Alternatively, if you’re using WordPress there are a range of great site speed plugins you can utilise. My personal favourite is Swift Performance Lite.
There are quite a lot site speed plugins but make sure to only activate one at a time and to carefully test each of the options in order to avoid breaking anything on site.
5. Exit Rate & Bounce Rate

The thing about exit rate and bounce rate is that they’re not always negative metrics.
It’s important to realise the meanings behind metrics before taking any action.
The first step is to understand the metrics, the second is to interpret the data with that understanding, and the third is to plan action.
What Is Exit Rate?
Exit rate shows the percentage of people for whom this page was the last page they visited in their session.
What Is Bounce Rate?
Bounce rate shows the percentage of people who leave the site after only visiting one page.
Understanding Exit Rate And Bounce Rate
Whilst these metrics might sound negative, that’s not always the case.
Say I were to search for the price of a haircut at my local hairdressers; I will very likely be able to find that out from my very first click from the search results.
This will count as both a bounce and an exit, but the page still did it’s job.
Similarly, if a user navigates through the site to complete the goal I wanted them to complete, then they are more than welcome to exit the website on those pages.
Therefore a high exit rate on the right pages is what we want.
What we don’t want is a high exit rate on the pages where we wanted users to take action or click on to other pages.
But be reasonable…
There will always be people who exit or bounce. We just want to minimise it to a reasonable rate, say… anywhere below 40%.
Optimising Pages With High Exit Or Bounce Rates

There are a few different scenarios depending on the action you would like your users to take.
Encourage Them To Convert To Your Goal
If you are a goal-oriented website such as an e-commerce store, a charity asking for donations or a local business trying to drive enquiries for example, then an exit rate on a content page is negative.
Therefore, the aim is to drive them to the goal page (product purchase, donate form, enquiry form) for them to exit after completing that transaction.
How you encourage users to take these actions is a whole other science called conversion rate optimisation. But some examples of actions you could take include:
- Adding call-to-actions (CTAs) to headers, footers and sidebars
- Using internal links to the CTAs within copy where relevant
- Tailoring content to the CTAs i.e. using language that inspires readers to want to take that action
- Making sure your CTAs are visible across all devices
- Reducing unnecessary, cluttered content
- Running A/B tests for things like button colours, CTA wording and frequency of ask to find out what converts best
Many of these CRO improvements are particularly important to ecommerce stores where you are encouraging users to purchase products. (P.S. If you have an online shop you should also read this guide to fixing the most common ecommerce site issues).
Encourage Users To Click On More Pages
If you are primarily a content-based website such as a blog or news website and you make money mostly from adverts, then you want people to continue clicking on more pages.
The best way to do this is with internal links.
If you don’t yet have enough relevant content, see the next point. If you do have enough relevant content, these points should help:
- For SEO purposes it’s important to link to relevant resources and not just any random page on your site. Look through your backlog of content and search for relevant keywords (you can use Google search operators to do this if you like).
- Find relevant pieces of text within your article that you can hyperlink to the pages you have found.
- Be creative and entice clicks with effective anchor text. For example: “it’s like that time I got chased by a gorilla in the jungle” is very intriguing!
Create Related Content
Another very good strategy for decreasing exit and bounce rates is to create additional, complimentary content that answers additional questions your users might have about a topic.
If you’ve ever visited Wikipedia you will notice they do this outstandly well; you can end up losing days clicking on a never ending stream of related topics.

Here you should look out for topics that are related but not necessarily relevant to be included within this page.
You should think:
- What additional questions might people have when visiting this page?
- What related topics or ideas might interest or inspire these readers?
Build yourself a list of great topic ideas, create strong pages for them, and then link to them from the original article.
For example…
Say I have a page about a weight loss diet, I could also create complimentary pages about: weight loss through exercise, positive sleep patterns or “what is a good BMI?”
These topics aren’t relevant enough to be included in the article but they incredibly powerful when linked to within the text i.e. “of course, exercise is also important for weight loss and you should do this in conjunction with your diet”.
The main thing you’re doing here is adding value to your user’s experience on the site, something that search engines love! Here’s a resource for generating topic ideas that may help you.
6. Behaviour Flow For User Journeys
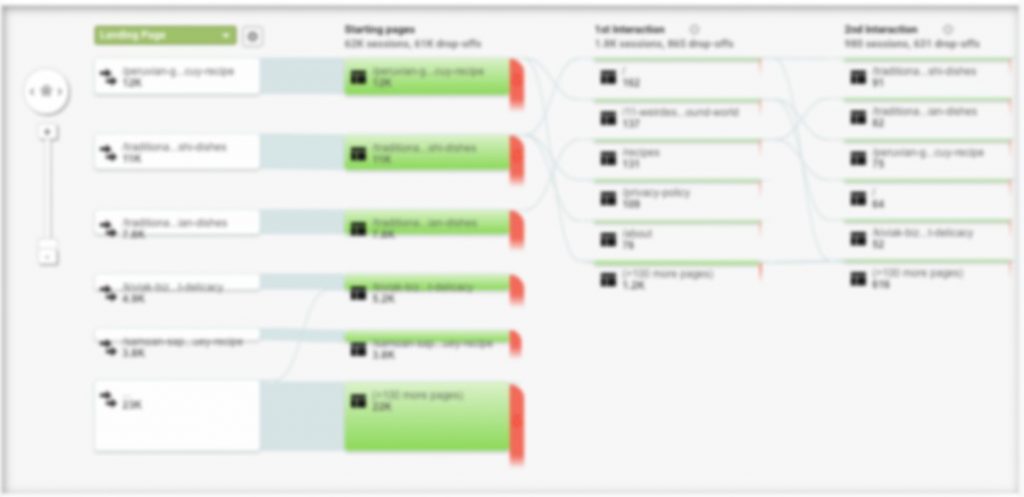
The behaviour flow charts are so useful for visually understanding the journeys of users from page to page.
The reason this section is important is because it lets you know whether or not people are taking the action you wanted them to take from reading your content.
This functionality is highly beneficial assuming that you have mapped out your ideal user journeys.
For example, if your website offers services then you will most likely want users to visit your “service pages” after reading any content. (On that note, check out feel free to find out about the SEO services I offer).
In particular, the behaviour flow is a powerful tool for developing your sales funnel.
The main point is that you want your traffic to convert. Behaviour flows lets you know if your user journeys are aiding that goal or hampering it.
You can find the Behaviour Flow section under “Behaviour”.
How to use the behaviour flows chart to optimise your site
Since behaviour flows is quite a visual feature, it’s actually incredibly simple to use.
First set your date range so that you have a meaningful amount of traffic. If your traffic is quite low you should look at a year’s worth of data but typically 3 months is a good range.
Click on behaviour flows and your chart will display based on landing pages. This is the default view and also the most useful.
The way to use the behaviour flow is actually quite straightforward. You basically want to find out if the behaviour flow matches the user journey you wanted people to take.
If it matches fine then great! No more work needed.
If it needs some work, consider these tips:
Tips to improve your sales funnel
- Make links to sales pages from landing pages more enticing i.e. “we have developed the most innovative AI software on the market”
- Use visual banners or buttons for calls-to-action
- Make sure sales pages are accessible from the header navigation and the footer
- If using a sidebar, make this the most prominent. You could use a sticky sidebar which follows the user as they scroll.
- Increase the number of links to the service from within the content (but don’t get spammy).
These are some very basic principles that would help to guide small to medium websites, but for larger and more complex businesses it is crucial to use much more sophisticated user journey funnels.
7. Devices data

The devices data is actually a lot more important than most people realise. Simply because getting this wrong can be devastating for your site.
I’m going to have to admit that I’ve been a victim of this in the past when naivety got the better of me…
With an early website I built I had a huge bounce rate across all blog posts which wouldn’t budge despite numerous optimisations.
When we build websites on desktop we generally assume that either other people will view it in the same way you are, or that your CMS will do its magic and optimise your site perfectly for any screen width.
We would be wrong to make these assumptions, especially after we tinker with formats, stylings and add plugins that change various elements.
For me, my bounce rate issue was caused by social media icons that took up half the width of a mobile screen but looked perfectly fine on desktop.
Once I fixed this issue my bounce rate restored itself, pages per session increased and I received a welcome boost in rankings as a result.
I also learned a valuable lesson: never forget how your audience is viewing your content.
How to use device data
Firstly you can find your user’s device preferences by going to Audience > Mobile > Overview in your Google Analytics account. Again, set your date range large enough to give you significant data.
The results will look something like this:
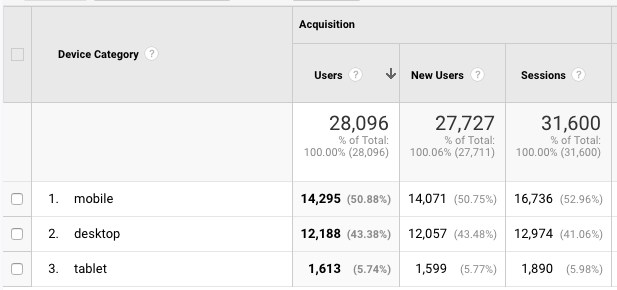
You might actually be surprised at the data you find in here.
If you’re a B2B website and have always assumed that your clients use desktops to find you, you might find out that actually that’s no longer the case.
The report will also show you the bounce rate by device. This is the most important metric to look at because it will give you a clear indication if the format is broken only for one specific screen size.
If you do find that one specific device has a significant bounce rate, you should take the following steps:
- Try to isolate the specific device if it is a mobile or tablet by going to the view “Devices” in the same section under “Mobile”. This will narrow the figures down into specific brands of phones or tablets.
- Check to see if there is one specific device that has a significantly higher bounce rate than the others. If there is not then move on to step 4.
- If you do find one problematic device, attempt to use that device to access your website.
- Begin testing all content types on your website by interacting with the pages from the device type or specific brand that is causing issues. Look for anything in particular that is causing usability issues.
- Attempt to take the action you would like users to take. For example, click on links, buttons, fill out forms and sign up for things.
- Note down all of your findings, no matter how small. You should now have a list of things to improve from the font size to functionalities.
More often than not the finding will be something glaringly obvious like a pop up that users cannot close or scrolling functionality that isn’t smooth.
However for small, incremental changes you would be surprised at the impact this can have on improving your site metrics.
I’ve had clients that have seen a 50% increase in time-on-page and pages-per-session simply because they changed the size of their fonts for mobile screen widths.
It really can be that effective.
The one final takeaway from this point is to check this data regularly and to conduct robust testing for any website changes to styles or functionality.
The last thing you want is to receive a loss of income from overlooking something so small.
8. Search Query Data

Ok this one is slightly cheating because this data actually comes from Google Search Console. But if you have configured your Google Analytics account correctly then you will be pulling in this data to your account view.
Search query data lets you know what terms people Googled in order to find your site.
If you haven’t yet configured this you can simply toggle the setting in your Admin > Property Settings like so:
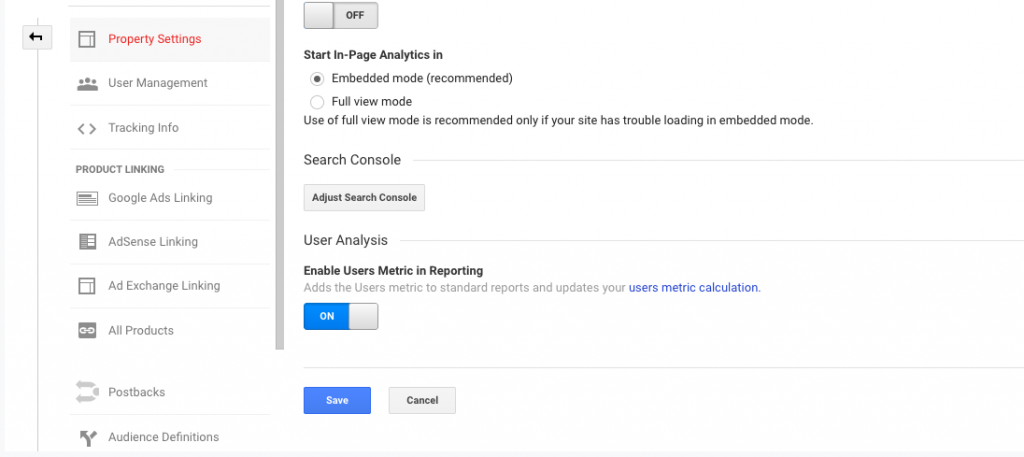
Once the connection has been made you should start to see data populated in the Acquisition section under Search Console.
You can find queries specific to individual pages under the section called Landing Pages. Click on each one to find all queries that led to a visit on that page.
How to use search query data to optimise your content
The data in the Landing Pages section will by sorted by Impressions by default. This shows you how many people saw your site from searching this query, regardless of whether they clicked on it or not.
I find this ordering the most beneficial because mostly you want to optimise your site based on search queries with the highest search volume.
(This is not always the case, especially if you are targeting a niche of a highly competitive search term – so feel free to order the data based on which relates most accurately to your site).
Now simply optimise your pages for the queries you have found in the data.
In order to do this, you can add high volume keywords to your:
- Meta titles
- Headings
- URLs
- Meta descriptions
- Content
And you can scatter a range of lower volume keywords throughout the text to increase relevance.
Of course, with bigger and more complex websites you would want to do this strategically. And an SEO specialist would delve much deeper by performing a deep analysis of the keywords in order to maximise the impact of optimisations.
But for simple quick wins on smaller websites, this basic method alone can be highly impactful.
Conclusion
I hope you found these tips for optimising your site with Google Analytics data useful. The main takeaway is that you can and should be using this extensive vault of data regularly to look for improvements.
You should get used to tweaking, testing and analysing based on the data you collect because this can really take your website to the next level.
If you would like to enquire about SEO support for your website, feel free to get in touch. I would be happy to discuss your project and how I can help.